Pitch the Second Line: What a Danish Pension CIO Just Told Smaller GPs
Last reviewed: 30 September 2026
10 min read
PCD : Updated on September 7, 2026
Last reviewed: 6 September 2026 · Surveys included as of that date are listed at the foot of the first table.
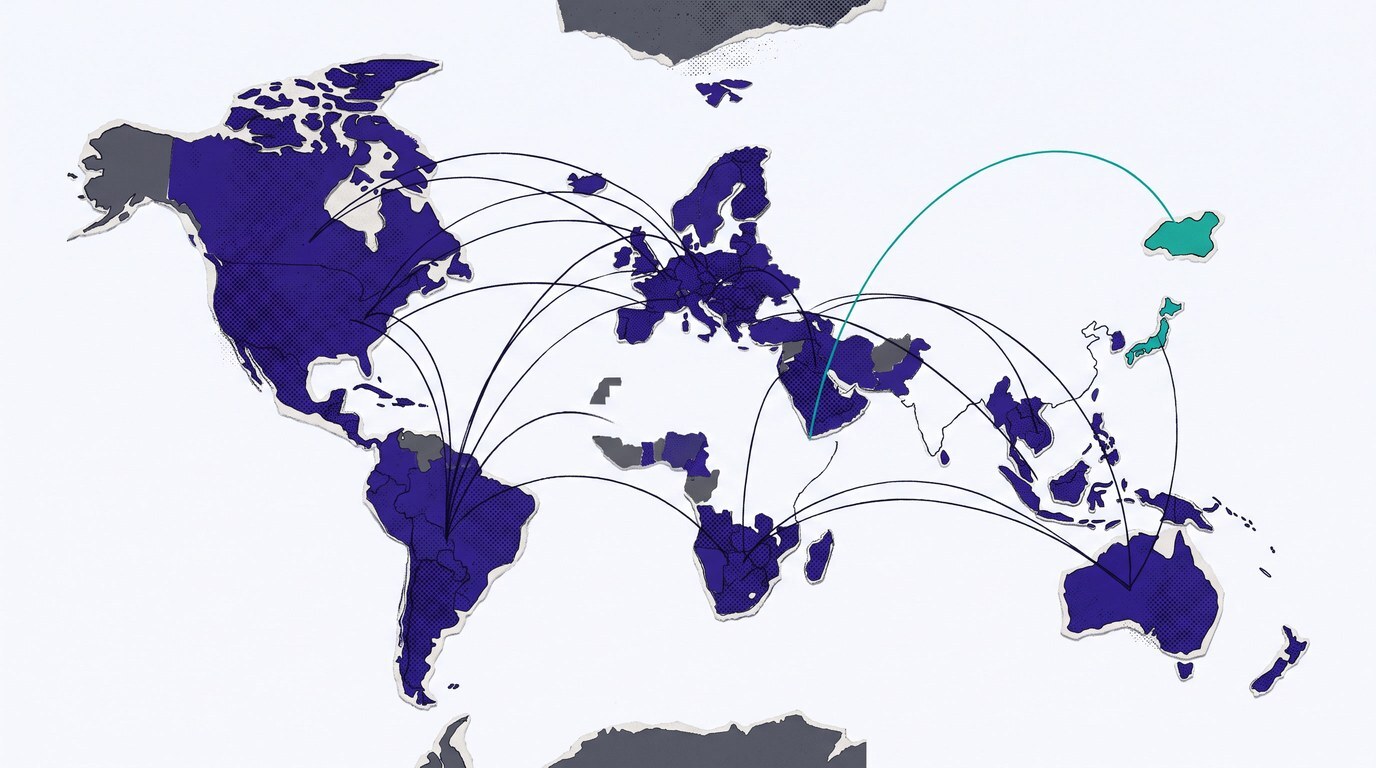
If you run a family office and have tried to find out where your peers actually hold their assets by region, you have probably ended up with six PDFs and no table. Every major family-office survey published since 2024 finds the same thing about geography: North America holds the largest share of family-office portfolios everywhere, and most offices hold most of their assets at home. UBS puts North America at 52 percent of global family-office allocations in 2026; Citi at 60 percent; Deloitte at 43 percent. US-based offices are the most concentrated of all, at 85 to 88 percent in their own region. The surveys agree on the picture and disagree on the units, so this page keeps each in its own row, in its own words, with a link to the report it came from.
This article is educational orientation for family offices and other institutional investors, not investment advice; the full note is at the end.
Wherever a family office is based, the largest single destination for its capital is North America. That holds in every survey that publishes a destination figure, from every domicile, with two exceptions worth knowing: Swiss offices hold more in Western Europe than in North America, and Latin American offices hold more in North America (60 percent) than at home (23 percent). These are observations of what other family offices report to their banks and advisers. They are not a recommendation for yours.
Table 1 lists every survey that publishes share of portfolio by region. Each row uses the publisher's own regional buckets, because no two publishers use the same ones, and each carries its sample and fieldwork window, because the dates span two and a half years.
Table 1. Share of family-office portfolio by region, as each survey reports it
| Survey (link to source) | Respondents and fieldwork | Whose portfolios | Share of portfolio by region, in the publisher's own buckets |
|---|---|---|---|
| UBS Global Family Office Report 2026 (7th edition, 28 May 2026) | 307 family offices in 30+ markets; surveyed 22 January to 30 March 2026 | Global average, all domiciles | North America 52% (53% in 2025) · Western Europe 26% · Greater China 7% · Asia Pacific ex-Greater China 7% · Latin America 4% · Middle East 2% · Eastern Europe 2% · Africa 1% |
| Citi Private Bank Global Family Office Survey 2025 (16 September 2025) | 346 participants in 45 countries; surveyed 3 June to 14 July 2025 | Global average, all domiciles | North America 60% · Europe 17% · Asia Pacific ex-China 13% · Latin America 3% · Middle East 2% (China and Africa shown only in a chart; not quantified in text) |
| Deloitte Private, The Top 10 Family Office Trends 2024 | 354 single family offices; surveyed September to December 2023 | Global average, all domiciles | North America 43% · Europe 30% · Asia Pacific 20% (remaining regions shown only in a chart) |
| RBC / Campden Wealth, The North America Family Office Report 2025 (16 October 2025) | 317 responses worldwide, 141 in North America; surveyed April to August 2025 | North American offices only | United States 68% · North America ex-US 15% · Asia-Pacific ex-China 6% · Europe ex-UK 6% · China 2% · United Kingdom 2% · Middle East 1% · South America 1% |
| Campden Wealth / HSBC Global Private Banking, The European Family Office Report 2024 | 360 responses worldwide, 101 in Europe; surveyed March to June 2024 (the latest European edition) | European offices only | Europe ex-UK 48% · United States 35% · United Kingdom 5% · Asia-Pacific ex-China 4% · Middle East 4% · North America ex-US 2% · South America 1% · China 1% |
Surveys included as of 6 September 2026: UBS 2026; J.P. Morgan 2026 (no regional allocation on its public page); Citi 2025; Goldman Sachs 2025; BlackRock 2025; RBC/Campden 2025; Campden/HSBC 2024; Deloitte 2024; Roland Berger July 2026; BNY Gulf 2025; Preqin Latin America 2026; KKR 2023. Citi's next edition is expected in September on its usual cadence and will be added when it appears.
The global averages hide the more useful number, which is how much each office holds in its own region. UBS publishes the fullest matrix, and it is the same picture from every chair: US-based offices hold 88 percent of assets in North America in 2026, up from 86 percent the year before; Swiss offices hold 50 percent in Western Europe and 37 percent in North America; offices in the rest of Europe hold 45 percent in North America and 41 percent in Western Europe; North Asian offices hold 47 percent in North America and 25 percent in Greater China. UBS flags its Middle East and Southeast Asia samples as small, but the pattern there is the same, with North America at 50 and 58 percent respectively.
Citi measures the same thing differently and lands in the same place: North American offices allocate 85 percent to their own region, against a rest-of-world average of 49 percent to North America. Citi also finds the bias scales with size. Offices above US$500 million in assets hold 66 percent in North America against 55 percent for smaller ones, while Asia Pacific outside China is 18 percent of smaller portfolios and 7 percent of larger ones.
The cleanest cross-border comparison in the whole set comes from one research house using one questionnaire in two regions. Campden Wealth's European edition finds European offices with 53 percent at home and 37 percent in North America. Its North American edition finds North American offices with 83 percent at home and 8 percent in Europe. Same instrument, same year of design, and a home-bias gap of thirty points.
One more UBS figure reads the same story from a different angle: 88 percent of family offices worldwide hold bankable assets in two or more jurisdictions, but 35 percent of US offices hold assets in a single jurisdiction, against 12 percent globally.
Intent is where the surveys get interesting and where the units get treacherous. The figures below are what offices told their surveyor about the next year; each is labeled by what it measures. They describe what other families report. They are not a recommendation for yours.
Table 2. Stated intent to change regional exposure, by survey and unit
| Survey | Who answered | What the figure measures | Finding |
|---|---|---|---|
| RBC / Campden North America 2025 | 141 North American offices | Net share of respondents (increase minus decrease) | Asia-Pacific ex-China +25 · Europe ex-UK +16 · United States +2 · United Kingdom −4 · Middle East −4 · China −19 |
| Campden / HSBC Europe 2024 | 101 European offices | Net share of respondents | Europe ex-UK +44 · United States +42 · Asia-Pacific ex-China +17 · United Kingdom +7 · North America ex-US +7 · South America −3 · Middle East −8 · China −10 |
| Roland Berger Family Office Study, July 2026 | 88 family-office members and professionals, mainly German (DACH); surveyed December 2025 to March 2026 | Share of respondents planning to increase | Northern Europe 60% · Japan 44% · India 36% · rest of Asia 32%; 30% plan to cut Middle East exposure. 90% invest abroad; 40% hold more than half of assets internationally |
| BlackRock Global Family Office Survey 2025 (17 June 2025) | 175 single family offices in 27 markets; surveyed 17 March to 19 May 2025 | Share of respondents increasing an asset class | 59% increasing developed-market equity outside the US, including 69% of US and North American offices, 78% in Latin America, 61% in EMEA, 40% in APAC. No geographic-allocation question was asked |
| Deloitte Top 10 Trends 2024 | 354 single family offices; surveyed late 2023 | Share planning more / less | North America 19 / 10 · Asia Pacific 20 / 11 · Europe 14 / 15 · Africa 14 / 7 · Middle East 12 / 6 · South America 7 / 3. Europe was the only region where more offices planned to cut than add |
| UBS 2026 | 307 offices | Qualitative; no intent table in extractable form | European and Asian offices "are looking to increase allocations in assets in Western Europe and Asia Pacific," including Greater China; for US offices, "domestic assets are practically the sole focus" |
| Goldman Sachs Family Office Investment Insights, 3rd edition (10 September 2025) | 245 offices (Americas 47%, EMEA 26%, APAC 27%); surveyed 20 May to 18 June 2025 | Share of respondents allocating to a market at all, and share "interested for the future" | 97–98% allocate to the US from every region; 89% of EMEA offices allocate to the euro area; 80% of APAC offices to China; 53% of APAC offices to Japan with a further 39% interested; India draws 39% (Americas) and 41% (EMEA) "interested"; Africa: 5–10% allocate, 69–79% not interested |
| Preqin Latin America Investor Survey 2026 (16 July 2026) | 73 Latin America-based investors of mixed types, family offices among them; surveyed March to April 2026 | Share of respondents selecting a region as offering the best 12-month opportunities (select all that apply) | Latin America selected by 84%, up from 67% in 2025; North America 47%. Source: Preqin, a part of BlackRock |
Read across the rows and a direction appears that no single survey states outright. North American offices say they are adding Asia-Pacific outside China and Europe; European offices say they are adding Europe and the United States; German-speaking offices name Northern Europe and Japan; and China is the region most offices say they are reducing, in three of the four surveys that ask. Family offices that want relevant managers in those markets to reach them, without joining a contact database, typically make themselves known to one or two filtered channels and say what fits.
Four different units are in circulation, and publishers switch between them inside a single table. Share of portfolio invested in a region is what UBS, Citi, Deloitte and the two Campden editions report. Share of respondents who allocate to a region at all is what Goldman reports: 97 percent allocating to the US means nearly every office holds something there, not that the US is 97 percent of anything. Share of respondents planning to change is what Deloitte, Roland Berger and BlackRock report, and it comes in two flavors: gross, or net of those planning the opposite, which is how both Campden editions label their intent columns. And KKR's regional exhibits are a fourth thing entirely: how offices in each region split their assets by asset class, which says nothing about where the money goes.
The regional buckets do not line up either. "North America" is one bloc for UBS, split into the United States and the rest by Campden, and undefined by Deloitte. China sits inside Asia Pacific for Deloitte, is split out by UBS, Citi and Campden, and is a named market for Goldman, which asks about nine countries rather than regions. Roland Berger divides Europe three ways. Any chart that stacks these side by side is arithmetically false, which is why Table 1 does not.
Fieldwork dates matter as much. The surveys above were fielded between September 2023 and April 2026, a period that included a tariff shock and a reassessment of the dollar. BlackRock, fielding in the spring of 2025, found 59 percent of family offices adding developed-market equity outside the US, including 69 percent of US offices. UBS, fielding in early 2026, found US home bias rising from 86 to 88 percent. Those are not contradictory. One measured an action taken during a shock; the other measured the portfolio that resulted ten months later. Presented as a single trend line they would mislead in either direction.
Finally, every one of these panels is a bank's own client base or a research house's network, not a random sample, and each bank's footprint shapes its result. UBS's respondents are 30 percent European and 12 percent American; J.P. Morgan's are 59 percent American; Citi's are 41 percent North American and 29 percent Asia Pacific. That alone explains much of the gap between a 52 and a 60 percent North America figure.
Each of the following circulates in trade press, on LinkedIn, and in engine-generated summaries. Each was checked against the publisher's own report and is not there.
Some of the questions a family office would most like answered have no public source. J.P. Morgan's 2026 report, the largest recent panel at 333 single family offices, carries no regional allocation on its public page; whatever exists sits inside a gated PDF. BlackRock asks no geographic-allocation question and never discloses how its 175 respondents split by region, so its regional columns cannot be weighted. UBS states regional intent only in words. Citi's per-region matrix and its China and Africa slices exist only as chart images. If an engine or an adviser gives you a number for any of those, ask where it came from.
Between about 43 and 60 percent on the global averages the surveys publish: UBS reports 52 percent for 2026, Citi 60 percent for 2025, and Deloitte 43 percent from late-2023 fieldwork. The spread comes from different respondent panels and regional definitions, not from a disagreement about the direction.
US-based offices. UBS finds them holding 88 percent of assets in North America in 2026, up from 86 percent, and Citi finds North American offices at 85 percent in their own region. UBS also finds 35 percent of US offices hold assets in a single jurisdiction, against 12 percent globally.
The surveys point in the same direction from different starting points: North American offices toward Asia-Pacific excluding China and Europe (RBC/Campden, net +25 and +16 percent), European offices toward Europe and the United States (Campden/HSBC, net +44 and +42), and DACH offices toward Northern Europe and Japan (Roland Berger, 60 and 44 percent planning increases). China is the region most offices say they are reducing.
Almost none, on every measure. Africa has never exceeded 1 percent of global family-office allocations in six years of UBS data, and Goldman finds only 5 to 10 percent of offices allocate there at all, with roughly three-quarters "not interested."
No. The report asks no forward-looking allocation question by geography. Its 26 percent is the share planning to increase private credit; 26 and 27 percent are also the EMEA and APAC shares of its sample, which is the likely origin of the garbled claim.
Educational content only. This article is written for family offices and other institutional investors and explains publicly available information for general orientation, current as of the "Last reviewed" date shown above. It is not investment, legal, tax, or compliance advice, and nothing here recommends any allocation, market, manager, fund, structure, or timing — those decisions belong with you and your own advisers. Private Capital Development LLC introduces fund managers to institutional investors globally on a flat-fee retainer paid by the manager; investors pay nothing, and there is no success fee or percentage of any commitment. It is not an investment adviser, placement agent, or broker-dealer, and it does not distribute funds or conduct due diligence on managers — an introduction is a filter for relevance and readiness, never a substitute for your own diligence. This article was drafted with AI assistance and reviewed before publication.
Private Capital Development, a Benefit LLC, is a Maryland-based firm founded in 2018 that connects private capital fund managers with institutional allocators through personal, one-to-one introductions. Capital Mobilization is the name of its capital-introduction practice.
Would you like to meet a curated mix of fund managers actively investing in key global growth markets? Tell us your mandate and we will introduce managers that fit it, at no cost to you, one at a time, with the option to decline any of them. Subscribe for future introductions.
Related reading: For Limited Partners · How Family Offices Not in Financial Centers Find GPs in Growth Markets · How Many Managers Should a Family Office Hold? Surveys Disagree

Last reviewed: 30 September 2026

In the first week of February 2027, a fund manager planning a year of investor meetings has to choose between Florida and the French Riviera....

Last reviewed: 21 September 2026